|
Pilot Project with Amity
High School
"Our students really felt honored to participate in this
pilot." The Amity Teachers
Executive Summary
On April 19, 2005 we tested the Counting Corals concept with 20 ninth
grade students from Amity High School using online images from two reef
zones in Bermuda (Figure 1). Students generated their own data, entered
it into
data sheets, and generated results. Student teams exceeded our
expectations in their ability to identified the benthos; their results
clearly show differences between the two reef types. Students
identified 59.6 ± 1.0% hard coral coverage and 2.3 ± 0.7% soft coral
coverage in the Terrace Reef. They found 18.8 ± 0.6% hard coral
coverage
and 10.9 ± 0.5% soft coral coverage in the Lagoon Reef. These results
are consistent among student groups (note the low standard errors)
and compare well with results from coral reef biologist Dr. Samantha de
Putron. Students did have some problems identifying macro algae and
also scored more unknowns than Dr. de Putron. This is not surprising as
Dr. de Putron has been working on Bermuda’s coral reefs for 7 years.
Our Teacher Advisory Team has
favorably assessed our pilot project and
has pointed out additional ways we can continue to improve.
Introduction
Counting Corals is an online hypothesis based learning program where
students can propose hypotheses about coral reefs in different physical
environments and then test them. They do this by classifying the plants
and animals living on a coral reef into categories and then comparing
these categories among different reefs. This information is then used
to characterize these reefs in terms of benthic over (benthic is
anything relating to the sea floor, i.e. animals and plants living on
the sea floor, as well as the rock, sand and other inorganic material).
Variation in benthic cover among reefs can be explained by the
different environmental conditions present. The broad benthic
categories used to describe the reefs are hard coral, soft coral,
algae, other invertebrates, and inorganic cover. Within these
categories are 3-5 small sub-categories.
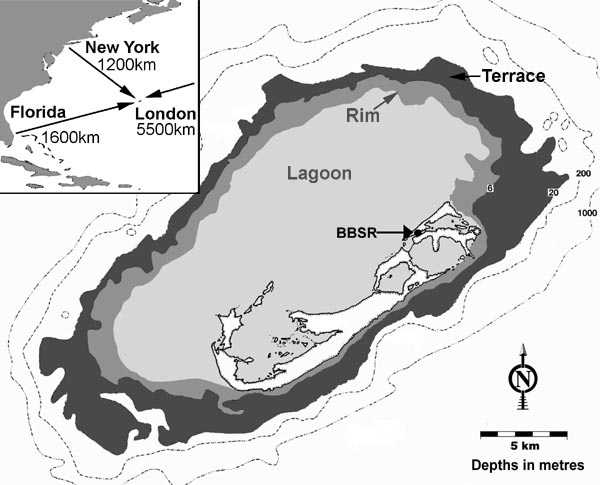
Figure 1. Bermuda Reef
Zones. BBSR is the Bermuda Biological Station for Research.
Methods
On April 19th, 2005, twenty Amity high school students participated in
a Counting Corals pilot study at the Bermuda Biological Station for
Research (BBSR). The students listened to a lecture briefing them on
the Counting Corals technique and objectives, followed by pictures and
descriptions of the benthic categories to be used. The students as a
class then went through a series of Counting Corals images on a
PowerPoint
presentation to make sure they could identify these benthic categories.
They
were then able to visit rim and lagoon coral reefs in Bermuda and
observe them first
hand. Additional images
from the pilot project are available here.
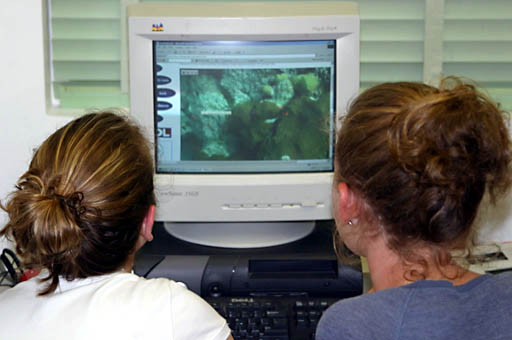
That night we ran the first pilot of the online version of
Counting Corals in the computer laboratory. The class was divided into
ten groups of two students and they worked in their pairs through a
total of 30 coral reef images, 15 images from a Terrace reef and 15
images from a Lagoonal reef in Bermuda. Once the exercise was
completed, the students entered their data into the Counting Corals Data Sheet
that automatically calculated the percent occurrence of each benthic
category by each team. The student’s data was then compared to the
results obtained by Dr. Samantha de Putron, a coral reef researcher,
via exactly the same procedure.
The objective of this pilot study with Amity High School was to
demonstrate that Counting Corals is a successful, hypothesis based
learning exercise for the students using methods that are used by coral
reef scientists. We also wanted to
see if the pilot version of Counting Corals would be too difficult for
our target audience of high school students. The 20 Amity students were
9th graders, the youngest of our target age group and therefore most
sensitive to having problems if Counting Corals was too difficult.
Results
"I count 4 brain corals, 2 sea rods,
and 1 sea fan. The remaining 3
points fall on turf algae."
The over-riding result was that Counting Corals was a success.
The students were clearly excited to learn about coral reefs and
listened
well to instruction and performed the exercise with care and precision.
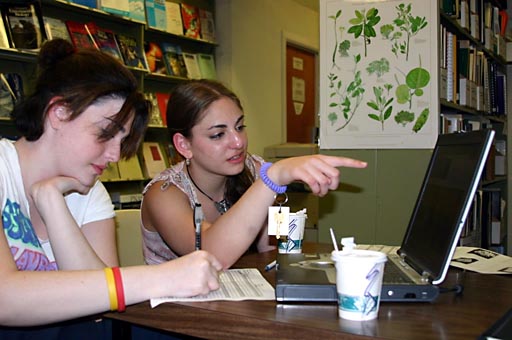
During the practical part of the exercise, the computer room was filled
with discussion and excitement as the students worked in pairs and
helped each other decide on assignment of the benthic categories. The
total time to complete the analysis of all 30 images on the computers
ranged from 1.5 to 2 hours, with the students taking a short break half
way through the exercise.
The data generated by the students proved that High School students
certainly can learn the identification of these coral reef benthic
categories and can use this tool to generate results somewhat similar
to that of a researcher, at least for many of the categories (Table 1
and 2). The consistency of results between different teams of students
surprised us. Please click on the following links for results for each
of the 10 teams for the Terrace Reef
and the Lagoon Reef. Here are Dr. Samantha de Putron's
Results in the same formatt for comparison.
Terrace
Reef Zone
|
Student's
Results
|
Researcher's
Results
|
Benthic Categories
|
Average and Standard
Error
|
Dr. de Putron
|
Inorganic Material
|
2.2 ± 0.9 %
|
1 %
|
Algae
|
35.2 ± 1.5 %
|
36 %
|
Hard Corals
|
59.6 ± 1.0 %
|
62 %
|
Soft Corals
|
2.3 ± 0.7 %
|
1 %
|
Other Invertebrates
|
0.7 ± 0.3 %
|
0 %
|
Table 1: Summary of
Counting Corals student and researcher’s results from the Terrace reef
zone in Bermuda. The student team’s results for each broad scale
benthic category are shown as the average from the 10 pairs of
students.
Lagoon
Reef Zone
|
Student's
Results
|
Researcher's
Results
|
Benthic Categories
|
Average and Standard
Error
|
Dr. de Putron
|
Inorganic Material
|
20.1 ± 3.1 %
|
14 %
|
Algae
|
48.1 ± 2.8 %
|
60 %
|
Hard Corals
|
18.8 ± 0.6 %
|
16 %
|
Soft Corals
|
10.9 ± 0.5 %
|
9 %
|
Other Invertebrates
|
2.1 ± 0.5 %
|
1 %
|
Table 2: Summary of
Counting Corals results from the Lagoon reef zone in Bermuda. The
student team’s results for each broad scale benthic category are shown
as the average from the 10 pairs of students.
Another success of this pilot project was learning where the students
had difficulty with identification of categories, which resulted in
slightly different data generated by the students compared to the
researcher. During the exercise many students noted that they found it
easier to identify the benthic categories in the images from the
Terrace reef zone and that distinguishing some categories proved
difficult in the images from the Lagoon reef. The collected data
clearly depicts this observation as the students’ results overall are
more closely aligned with that of the researcher for the Terrace reef
compared to the Lagoon reef (Tables 1 and 2). Looking more closely at
the data reveals that the discrepancy among the students (shown by the
relatively large standard errors) and between the students and the
researcher, is distinguishing the inorganic and algae categories at the
Lagoon reef (Table 2). Coral coverage is lower at the lagoon reef
compared to the Terrace and there is a greater portion of exposed rock
at the former. Turf (filamentous) algae quickly colonize any rock on
reefs, so what may look like bare rock (inorganic category) to the
untrained eye is actually algae. These algae can be seen when looking
at a clear close-up photographic image of a reef area or when
snorkeling or diving on a reef. However, the image quality obtained by
the video transect technique is not as clear and the differences
between the categories can be confusing. An online guide for
identification of all benthic categories is part of the current
submitted proposal. The realization of the exact nature of
identification confusion as shown by this pilot project will enable the
Counting Corals team to address these problems accurately within the
guide. Including low resolution pictures extracted from video and
high resolution images of turf algae and comparing them with similiar
images of bare rock in the proposed online guide would help minimize
this confusion.
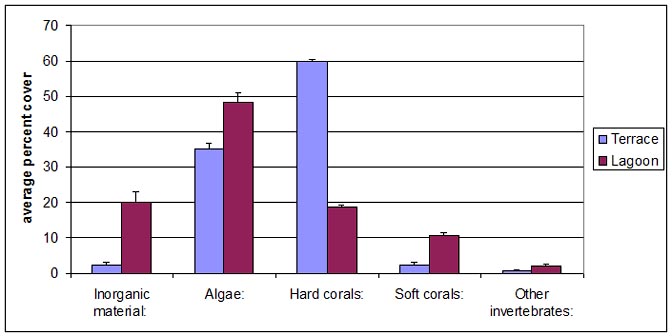
Figure 2. Benthic cover
at two Bermuda Reef
Zones
A graphic representation of the student’s data shows the difference in
the benthic cover between the
Terrace and Lagoon reefs as generated from the 30 images used in this
Counting
Corals exercise (Figure 2). Hard coral coverage is much greater at the
Terrace
reef compared to the Lagoon, whereas inorganic material and algae are
greater represented at the Lagoon. Soft corals are more abundant at the
Lagoon
and other invertebrates generally comprise a small portion of benthic
cover
at both reefs. The student’s results are in line with previously
published data
for Bermuda’s reefs recorded by coral reef researchers at BBSR. For
example, coral cover along the Terrace reef has previously
been documented as being up to 60% and spatially varies at the Lagoon
reefs
from 16-38% (Smith et al., 1994). A more comprehensive study in
2004 at BBSR revealed coral cover percentages of
45-65% at the Terrace and 11-23% at the Lagoon reefs (Anon, 2005). The
student’s results were of an average coral cover of 59.6% at the
Terrace reef and
18.8% at the Lagoon reef. Therefore, High School students using
Counting
Corals can generate data similar to that generated by coral reef
scientists and
this data can be used to compare coral reefs that are exposed to
different
environmental parameters.
The data presented here shows broad category representation of the
results. The
students were also able to identify sub-categories of benthic cover
within these
broad categories, e.g. hard corals were identified into four species
groups,
soft corals into 3 species groups and algae by three major groupings in
the Counting Corals Data Sheet.
Therefore,
additional analysis of the data can
also include looking more closely within the categories to see finer
scale
variation between the reef areas. All results can also then be
discussed in
relation to the varying environmental conditions at the reef sites and
how this
structures the coral community and overall benthic composition. The
students are
therefore engaged not only in inquiry based leaning via the Counting
Corals
technique but also in using math and excel spreadsheets, and learning
the general
ecology of coral reefs, the most diverse of the marine ecosystems.
References
Smith, S.R., K.M. Musik (1994). Aspects of the
distribution and ecology of shallow water scleractinian and
octocorallian species on Bermudian reefs. Advances in Reef Sciences,
Miami. pp. 115-116
Anon (2005). Bermuda Biological Station for Research, Inc. (BBSR)
Marine Environmental Program Annual, Annual Report 2004-2005. Bermuda
Biological Station for Research, Inc., St George's. Bermuda.
Teacher Assesment
Walking in the Footsteps of
a Coral Reef Researcher
Pilot project assessment by
Nancy Goss
Imagine being a ninth grade student from the state of Connecticut and
being able to experience what an actual scientist does at the Bermuda
Biological Station for Research in Bermuda. That is just the type of
opportunity that our students from Amity High School in Woodbridge,
Connecticut had through the Counting Corals Pilot Program in which we
participated on Tuesday, April 19, 2005.
Dr. James Wood, an author of the grant proposal and cephalopod expert
at the station, explained that through this pilot on Counting Corals,
our students would be walking in the footsteps of Dr. Samantha de
Putron.
Dr. Samantha de Putron, a post-doctoral scientist at the Bermuda
Biological Station for Research, has been conducting research on the
coral reefs in Bermuda since 1998. She shared with our students the
process that she uses and which scientists around the world use to
obtain a baseline for coral growth. Through a PowerPoint lecture,
students learned how video transect images are taken of the patch reefs
found in the lagoon and the terrace reefs in Bermuda.
Samantha also instructed our students in the various types of hard and
soft corals found in Bermuda and the three types of algae growth.
Using an actual transect image with ten random points indicated on it,
she lead our students through the identification of the hard and soft
corals, algae, and other benthic cover to show them how to record the
data obtained from the ten points on to a data collection sheet which
she provided..
After going through several examples of transect images with the class
as a whole, students were able to look at cut or sliced coral
skeletons. This gave our students additional practice in identifying
hard corals.
Students chose partners with whom to work for the next portion of the
pilot. Using the Counting Corals website students located the
fifteen lagoon transects. With their data collection sheet in hand,
each team of students worked feverishly to identify each of the ten
random points for each of the images.
As Dr. de Putron, Dr. Wood, and the five Amity teachers looked on,
student pairs worked tirelessly to complete their data collection for
the fifteen lagoon transect images. Teachers provided only moral
support. When students were uncertain or disagreed between themselves,
some looked to the instructors for the “right” answers. Instructors
simply replied, “We know you can figure this out. Do your best.”
Teachers noted that students seemed to be the most confused with
identifying the algal types. It was noted that more time would need to
be devoted to the teaching of the differences among the algae. Also,
some of the transect images were a bit blurred causing some student
pairs to feel uncertain in their identification of the points.
Students were given a well deserved rest period before beginning the
second set of fifteen transect images from the terrace reefs. The same
teams of students worked together to complete their data sheet for all
transects.
As the activity came to a conclusion, students entered the data from
both of their collection sheets into a spreadsheet on the Counting
Corals website. They would have to wait until the wrap up session the
following morning to find out how closely their data matched that of
Dr. de Putron’s.
In the wrap up session the next morning, Dr. de Putron provided
students with her results from the same transect images as well as each
team’s results. The pie charts revealing the percentage of cover for
the various corals and algae were surprisingly similar. This thrilled
the students to know that they could actually do the work of a
scientist.
The results did show that the greatest problem students encountered was
with the algae and unknown points. Students expressed the need to do
the study earlier in the day when they were less tired rather than the
evening session we had chosen for this activity. They said it took a
lot more concentration than they initially thought it would take.
Samantha concluded the session by showing the students the next step
that she as a scientist would do. Analysis of data always raises more
questions for her. She modeled her thought process by looking at the
data and thinking aloud. Students could readily see how scientists’
work is rarely complete as each project raises more questions and areas
for study.
Nancy W. Goss
Amity Regional High School
Subtropical Environments Director
April 22, 2005
"This is great!!!"
Dr. James B. Wood
jwood@countingcorals.org
|